Capital One • 2026
Designing clarity for enterprise talent calibration

Role
Product Manager Intern
Timeline
2 Months
Skills
User Interviews
Prototyping
Data Visualization
Team
Senior PM
Associate PM
Product Designer
Overview
What is Executive Compass?
An internal HR product built for calibration periods across Capital One. It gives VPs and HRBPs a shared view of their organizations. My project focused on the heatmap product; each row represented a people leader, each column a meaningful team metric, and the full experience made cross-functional patterns easier to see, discuss, and act on.
Problem
Cross-functional talent data was hard to read
Every calibration period, VPs and HR business partners across Capital One needed to compare performance signal across teams, enterprise-wide, to make consistent, defensible decisions about ratings and promotions. The data existed. What didn't exist was a way to see the right patterns at the right altitude, fast enough to matter during a compressed decision window.
Process before Executive Compass
Executives would prepare for calibration
Data analysts or HR would be approached to pull information and metrics
Data would be cleaned and fetched from multiple sources
A visualization of aggregated data would be created
Executives would get data for presentation
In theory, this process sounds fine however, what goes unnoticed is the weakened trust between executives and data sources. By the time the data is aggregated and information is presented, it may already be out of date. Different orgs also have different thresholds that may not reflect truthfully with the enterprise set thresholds.
Research
Interviews with executives
I interviewed 10 VPs and executives to understand how they actually behaved during calibration: did they scan top to bottom looking for outliers, or did they go leader by leader? Did they think in terms of one team at a time, or did they need to hold multiple teams in view at once to compare them?
Interview structure

Process walkthrough
Watched users walk through their actual workflow: how they pull and analyze data today. Real behavior surfaced friction they wouldn't have thought to mention.

Pain points and magic wand
Asked what frustrated them most, then: if you could add one feature with no constraints, what would it be. Got real priorities, not just complaints.

Prototype reaction
Showed an early prototype and watched their reaction: what matched their expectations, what surprised them, what missed.
Design
Design Direction
This project required a design and technical background as this new product had to visually fit into a preexisting lineup of other data analytic tools while maintaining the current data pipeline. This meant designing the product and prototyping it in a way that required close collaboration with the product designer and lead engineer.
Where the matrix created clarity
The most valuable moment was the cross-functional comparison: a VP could scan their leaders against consistent measures, notice a pattern, then use the surrounding context to guide a more informed conversation. The design deliberately kept the grid familiar while introducing hierarchy through grouping, emphasis, and progressive disclosure.
Prototype
AI workflow
During my time at Capital One, I had developed a prototyping workflow that allows anyone to run a design audit on a product which would populate a markdown file and understand the information architecture.
With this fully done it would then allow the user to upload a PRD or simply describe the product that they are trying to create and it would create a prototype that looked almost identical to the design language of the specific specific product line that they were building into.
This is a workflow I launched during my internship and is being used by product managers across the enterprise.
Mockup
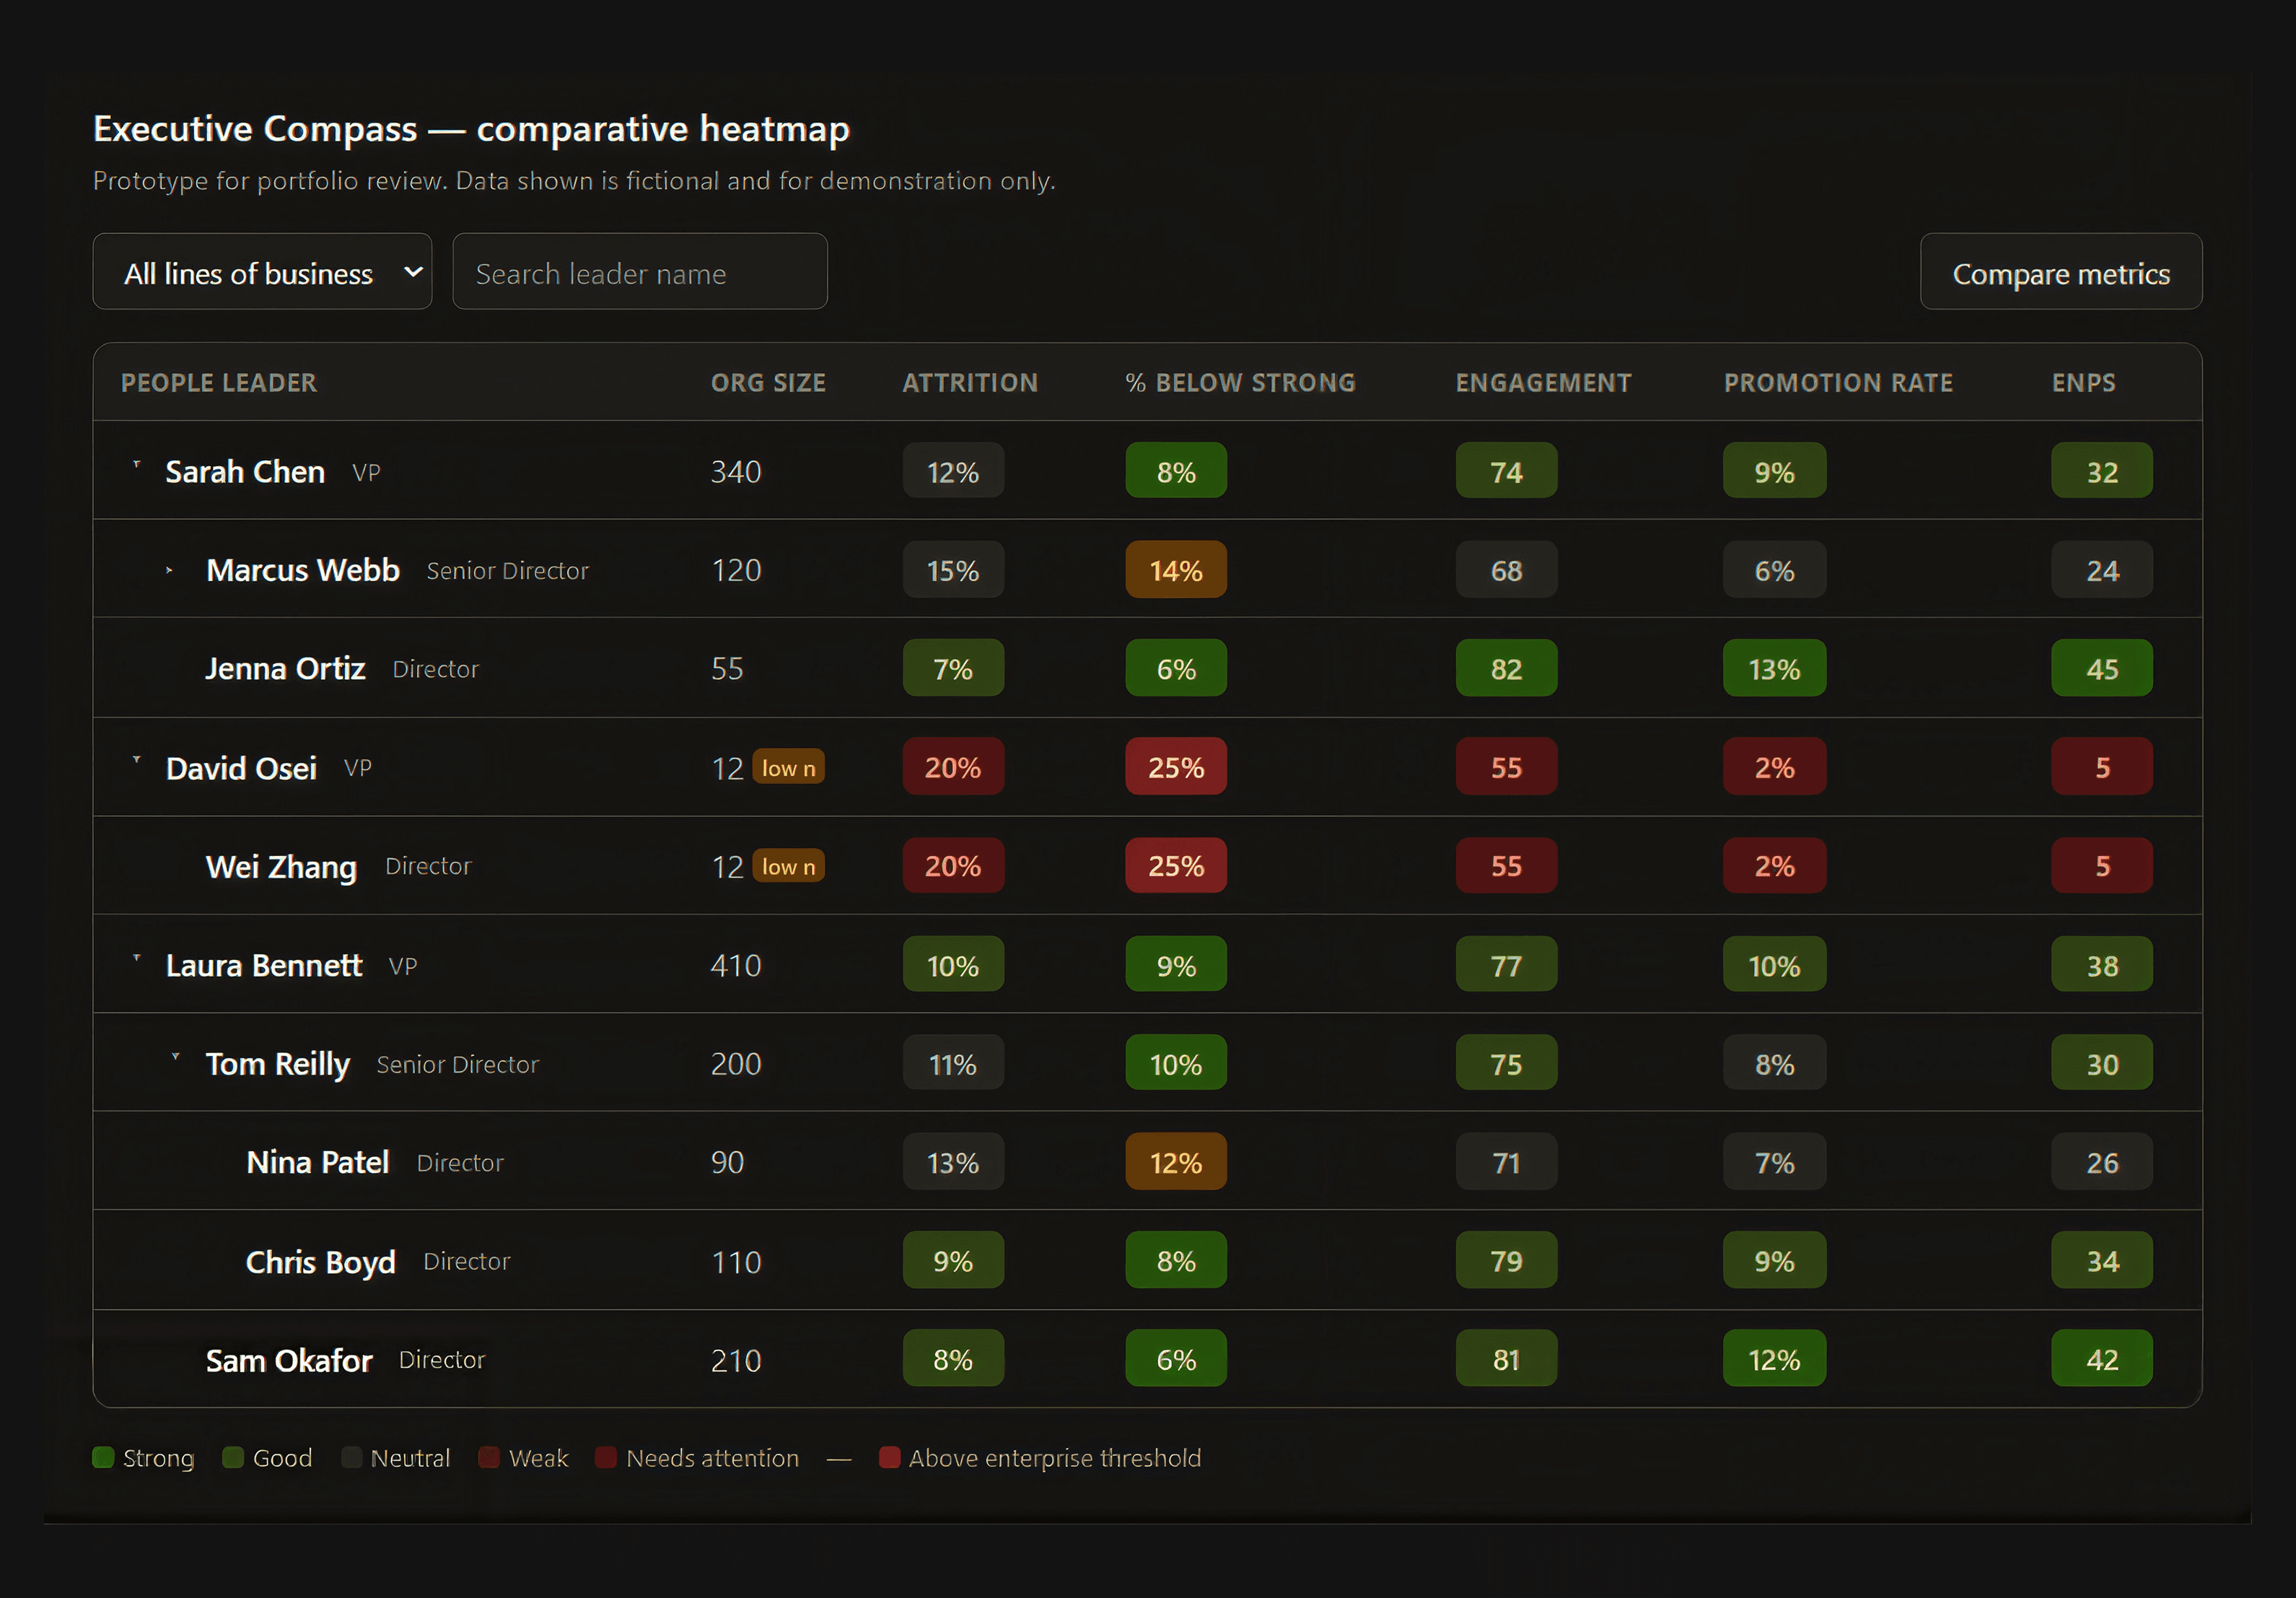
A Claude Code generated example of this product
Reflection
Key Takeaways
Internal teams have more resources
When I was first told I would be in the HR department I was not too happy. However, this opportunity showed me how powerful working on internal tooling is, you can interview more users, ship faster, and know for a fact your product will be used by a large population of people internally.
Design is baked into product management
I thought that PMs wouldn't have to focus too much on design but it varies from project to project. I had the opportunity to leverage my design skills and create both a product and a workflow which would not have been possible without my design and technical background.